Background/ Context
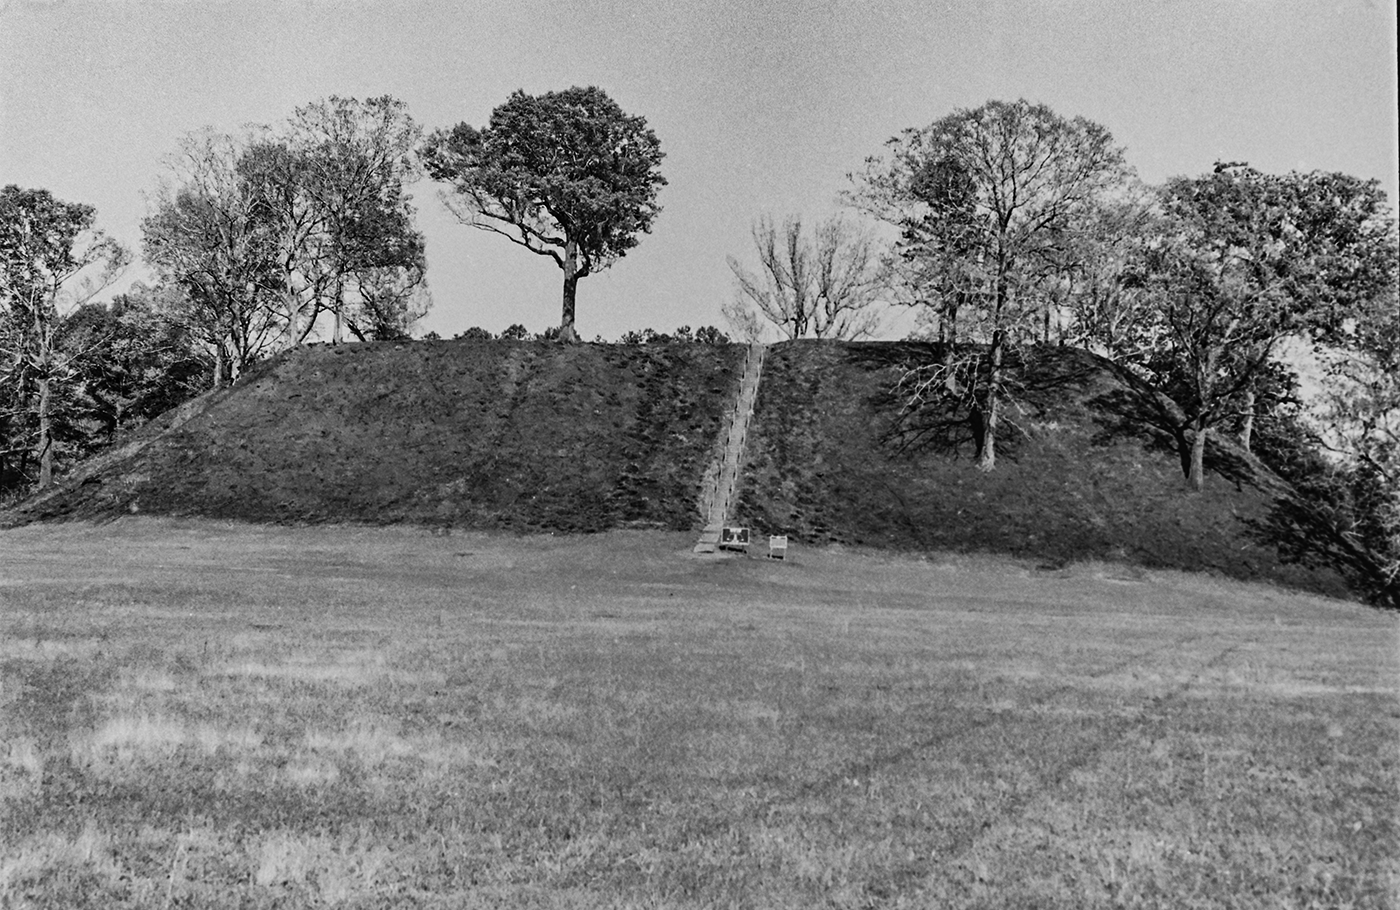
My first experience of prehistoric earthworks was at Kolomoki Mounds State Park in Georgia. I was stationed at NAS Albany, Georgia (in the early 1970s), awaiting orders (to go overseas) to my Aerial Reconnaissance Squadron (USN RVAH-9). I borrowed a motorcycle from a friend, drove off base, headed west to explore the countryside, and ended up at the State Park. I have few memories of being there, but it must have left a subtle impression on me. Later, as an archaeologist and college professor, I would take students (in the 1990s) to the site as part of a three-day tour of prehistoric sites (Figure 1). We camped at the park property campgrounds, walked the archaeological site, and visited the museum.
The Mound site had two major prehistoric cultural occupations; the Swift Creek and Weedon Island cultures used the area from AD 300-900 (Pluckhahn 2003). These cultures occupied large sections of Georgia and parts of Florida. They are defined by their ceramic styles, technology, settlements, and mound building (Regionally Swift Creek 100-800 CE [Common Era] and Weeden Island 500-1000 CE range across a broader time period). At Kolomoki, both cultures are represented by their ceramics, earthworks, and village remains (i.e., pits, middens, and earthworks). At least nine mounds remain at the site, with two enclosure walls visible on older aerial photos and recent LiDAR imagery.
Four sheets of Lidar data were used to create the images displayed here. The archaeological site is located at the intersection of the four sheets. Luckily, they were all part of the same mission flight, which is not the case with Moundville in Alabama, located on the county line and part of two different mission flights in two different years. But I digress. Figure 3 displays the general area of the archaeological site as part of the larger State Park. I have referenced Mound A to give you a sense of scale in regard to the other mounds, most of which are located to the west.
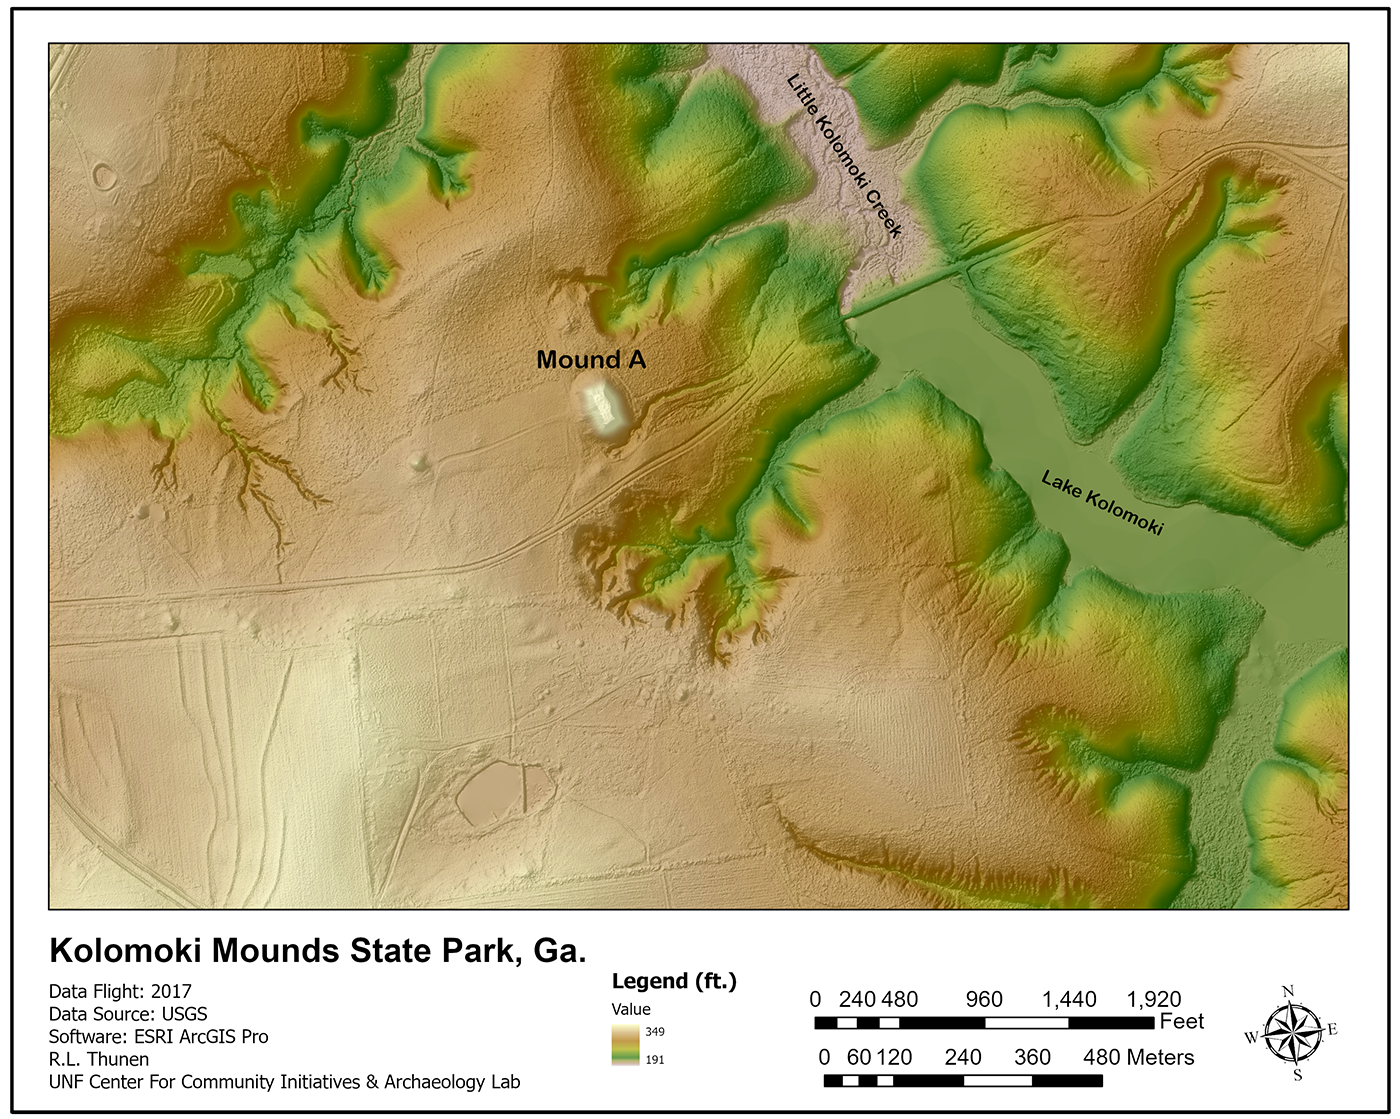
Of the mounds, Mound A is the most striking of the group. Rising some 62 feet (19 meters) above the ground, it dominates the area of the archaeological landscape (see M Jared Woods and Thomas J. Pluchahn’s 2018 fascinating article on this). Mound A is a platform mound and, by volume, is the largest Mound from the time period. Since the late 19th century, historians, surveyors, and archaeologists have examined, excavated, and measured Mound A. The latest research by M. Jared Wood and Thomas J. Pluckhahn reflects the newest technology to calculate the mound’s height and volume. As readers of this blog know, I use aerial lidar scans (ALS) for the images I create. My data comes from overflights for flood control, soil surveys, environmental research, etc. This data is freely available through the USGS and state websites. The Wood and Pluchahn’s Lidar on Mound A was done using a Leica Terrestrial Scanner (several case studies shown here) to create a very dense point cloud of the Mound. Methodologically, they did thirty-one 360-degree scans of the Mound. They moved the unit around the Mound, on the Mound, and on the Mound’s top. This type of scanning creates a thick point cloud (meaning lots of data points), which allows for micro-topographical relief detail on the mound’s surface. This type of scanning is now used, if you can afford it, in a number of important locations around the world for the preservation of cultural heritage, like rock art. The famous Rosslyn Chapel in Scotland has been lidar scanned to help record the remarkable stone carvings inside and outside the chapel. Using these data sets, you can, of course, 3D print the data for inclusion in public displays or archive preservation.
Figure 4 displays the known mounds and the locations of mounds plowed down by historical agriculture. Other mounds may have been so degraded that the best way to evaluate them would be by ground penetrating radar or a magnetometer. Each remote sensing technique has benefits and allows the archaeologist to “see” below the surface without digging. Just to reinforce the idea here, Lidar doesn’t allow you to “see” below the surface unless the feature, i.e. a foundation, well, fit pit, burial, etc., has somehow impacted the surface soils. Other kinds of remote sensing should be used in tandem with Lidar.
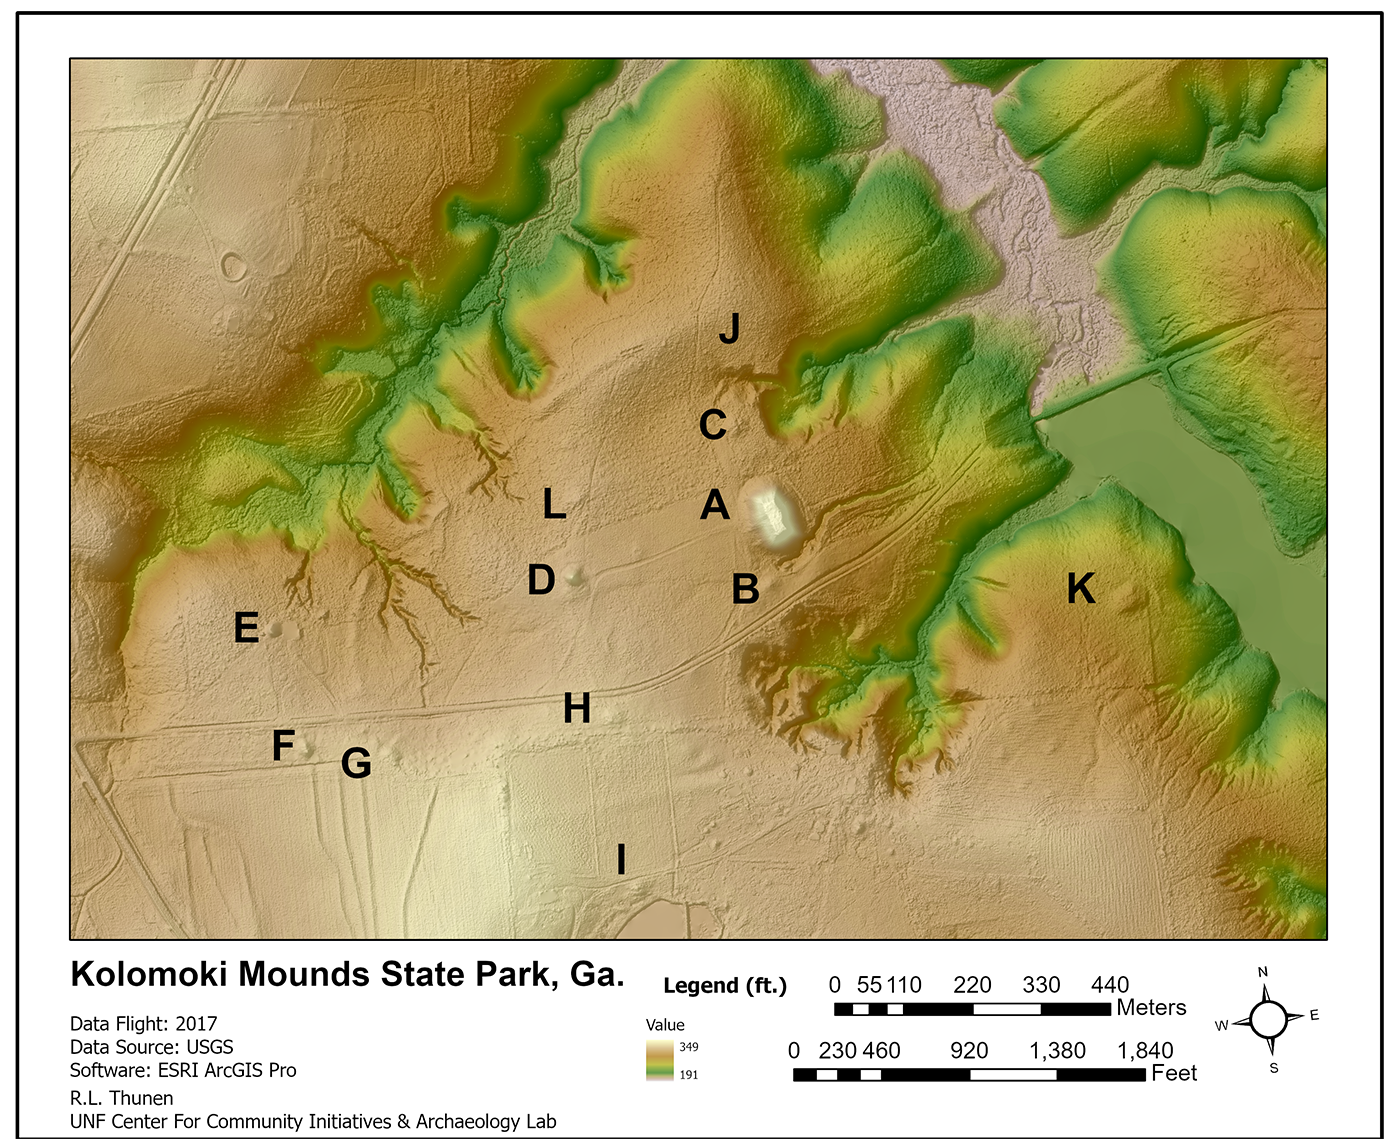
Mounds D and E are two other important and well-known mounds in the history of prehistoric site occupation. Both mounds are mortuary mounds and have complex construction histories and uses. Mound D had log-lined and rock slab tombs within. Prehistoric peoples used these types of burial facilities in a number of sites in the south and midwest during this period. Often, the crypts were reused and in continued use for specific times, then covered over, and other burial interments, such as bundle burials, were placed close to the crypt. Prehistoric peoples included ritual offerings such as ceramic vessels in their mortuary ceremonies. Colored soils and different types of soils were used at Kolomoki for the complex ritual cycle of these earthworks. Mound E is very similar to Mound D in its construction and use of these earthworks.
Two linear earthworks (Figure 5) define the core occupational area’s north and south boundaries (Figure 5). These two earthworks may be one continuous “U” shaped earthwork that has been damaged/eroded in its center. Interesting, Mound E is outside that boundary. Both “walls” are barely discernible on the landscape today; sections can be viewed on Lidar and older aerial photos. Agricultural plowing, particularly on the southern wall section, has, over the years, lowered the wall to a faint reflection or leveled the soil entirely so that the Lidar does not show the wall. This arc embankment around the central core created an inward focus of the houses, mounds, and a central plaza. These wall earthworks are not defensive structures like later Mississippian palisades (see the Shiloh blog post) but were used to define and reinforce the notion of community, boundary, and activities.
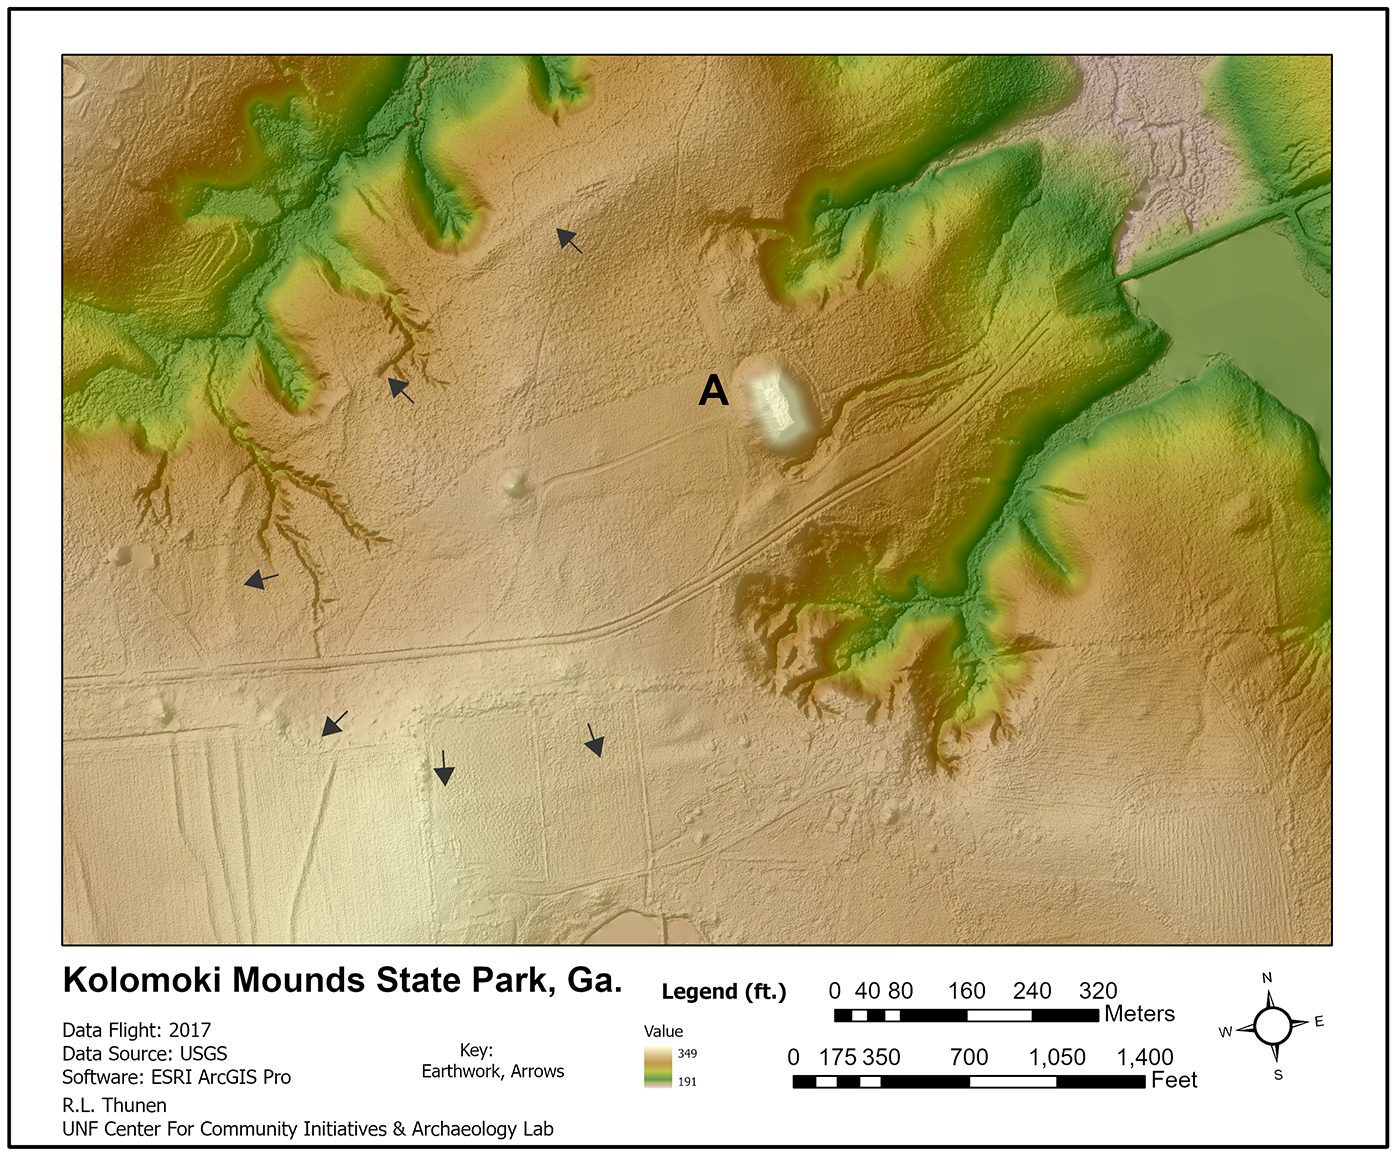
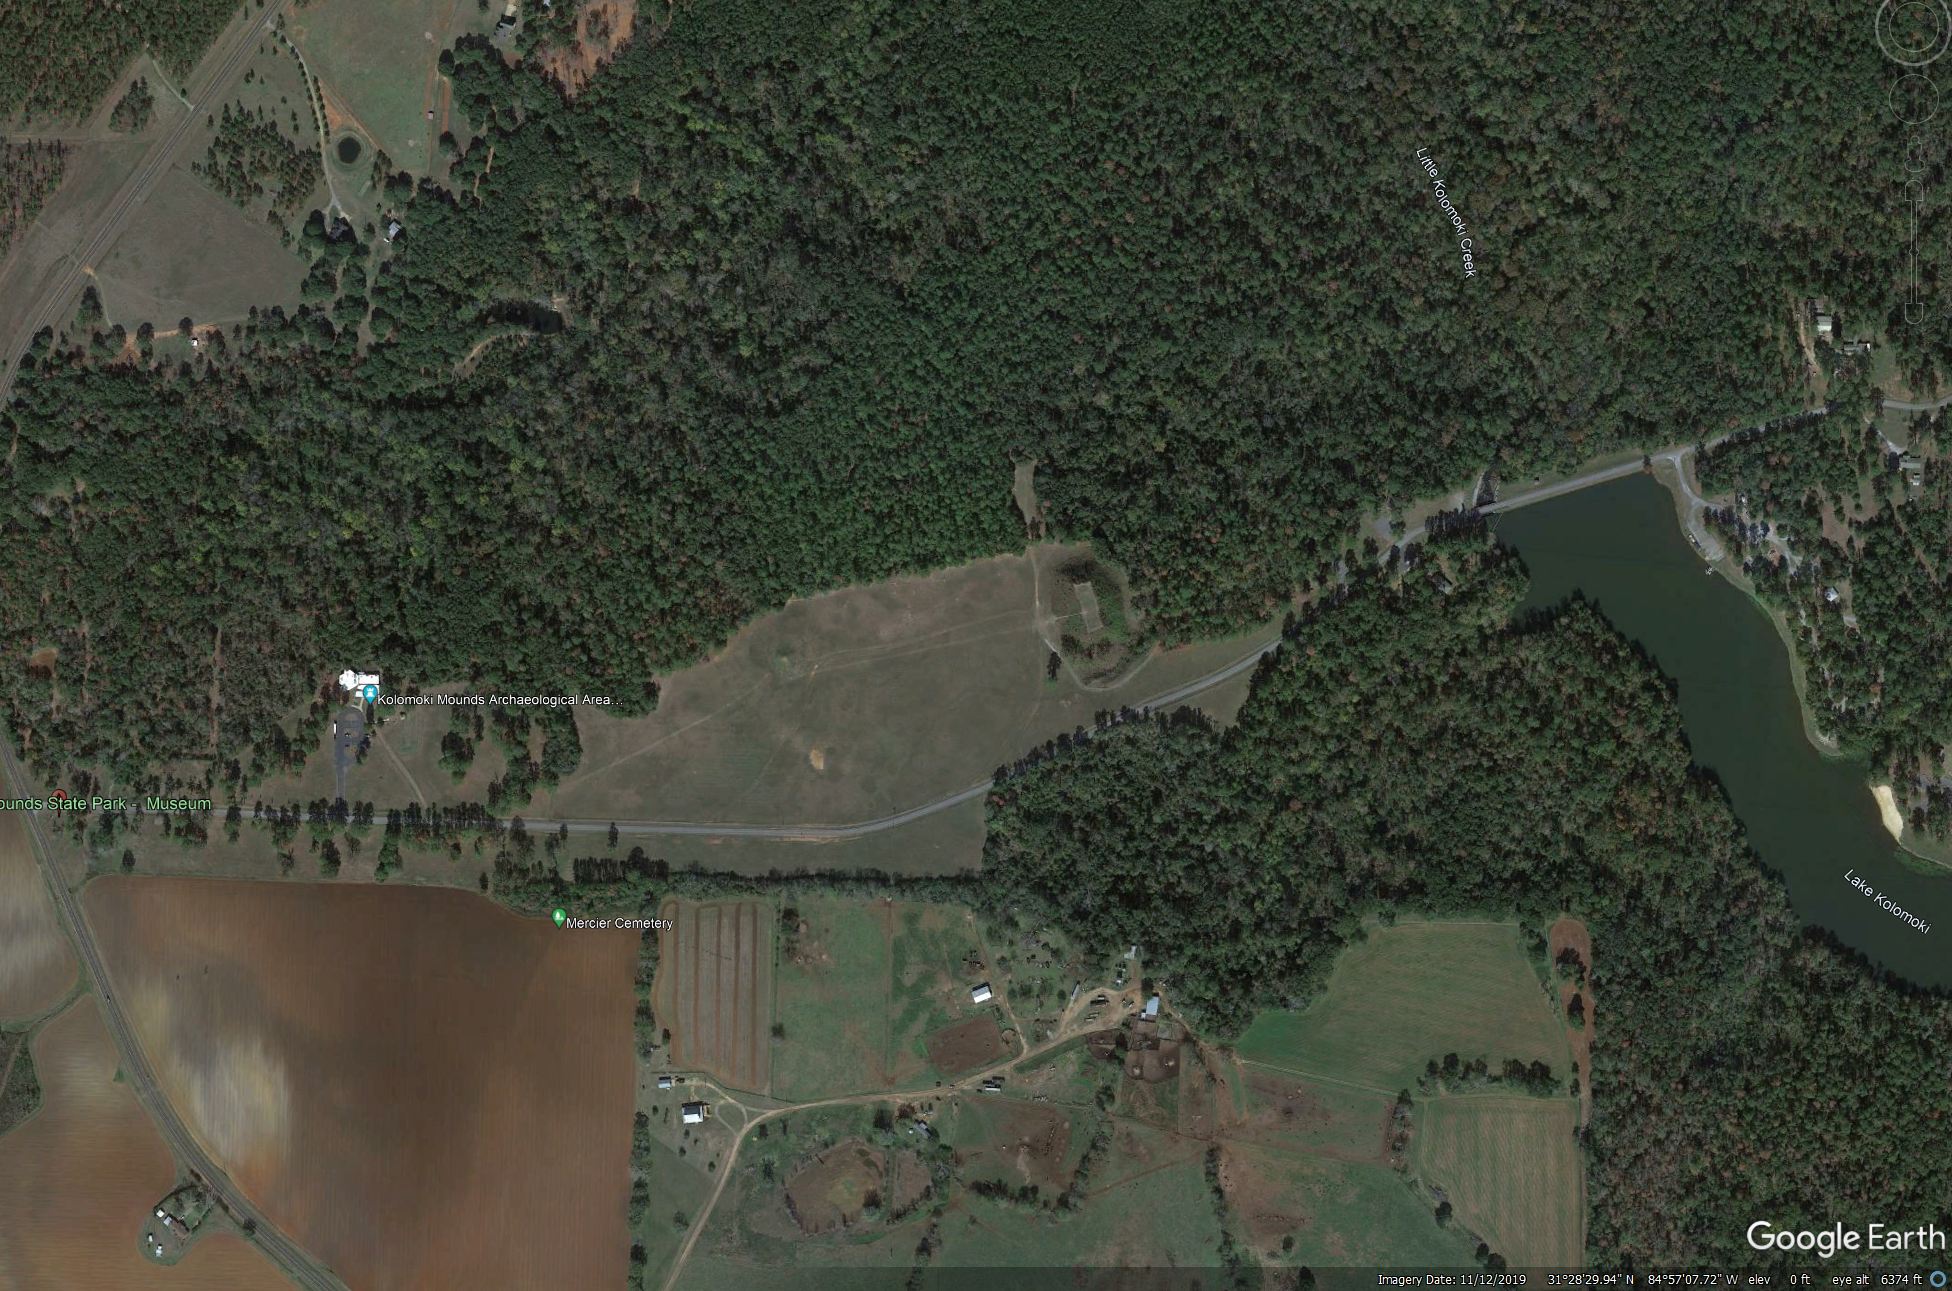
The earth embankment walls show up clearly in the Lidar image ( compared to Figure 2, the Google Earth image where the northern wall is in the trees and brush, and the southern wall is impacted by historic farming practices. Looking at Figure 5, one can see that the south embankment wall has a faint definition. In contrast, the north embankment is more apparent because of its inclusion in the park boundaries, while the south wall is located on private property and historically subjected to agricultural practices. Recent archaeology in the park has focused on understanding the nature of cultural occupation during the Swift Creek and Weedon Island periods (see references below). Led by Thomas Pluckhahn and others, this research includes shovel testing and block excavations across the site’s northern, western, and southern portions to provide a more nuanced understanding of the history and chronology of the site (see Pluckhahan et al. 2018).
References, Links, and Comments:
Sadly, pottery from Bill Sear’s archaeological excavations (late 1940s & 1950s) at Kolomoki was stolen from the on-site museum in March of 1974. A few pieces have been recovered, but most of the material is still missing. More information can be found here: Stolen Pottery from Kolomoki State Park.
M. Jared Wood and Thomas J. Pluckhahan, 2018 Terra incognita: terrestrial LiDAR documentation of Mound A at Kolomoki ((ER1). Southeastern Archaeology. VOL. 37, NO. 2. pp 95-111.
Thomas Pluckhahan, 2003 Kolomoki: Settlement, Ceremony, and Status in the Deep South, A.D, 350 to 750. University of Alabama Press, Tuscaloosa.
Thomas Pluckhahan, Matin Menz, Shaun E. West, and Neil J. Wallis, 2018 A New History of Community Formation and Change at Kolomoki, American Antiquity, April 2018, Vol. 83, NO. 2, pp. 320-344. Cambridge University Press.
The Rosslyn Chapel TLS scans have been incorporated into a free app, which can be downloaded from the Apple or the Android App Store.
The opinions offered here are the author’s and do not mean an endorsement by the UNF Archaeology Lab, Center for Community Initiatives, or the University of North Florida.
Maps used in this blog were created using ArcGIS® software by Esri. ArcGIS Pro™ is the intellectual property of Esri and is used herein under license. Copyright © Esri. All rights reserved. For more information about Esri® software, please visit www.esri.com.