Context/Background
Fort George Island is a jewel in northeast Florida. Located on the north side of the St. Johns River, it is one of a series of barrier islands that run north along the Florida, Georgia, South, and North Carolina shoreline. Private property, State and National Park properties, and a rich prehistorical and historical record mark the landscape of Fort George Island. The ecological and cultural records make this island a gem and shine it does.
But now, a little technological discussion. First, the lidar flight for these images was done in 2007. I mention this because barrier islands are dynamic places where ecology and geology can shift due to erosion, weather, and development. The island has eight “tiles” of data (Lidar data is “cut” into tiles or sheets to make the point cloud data manageable).
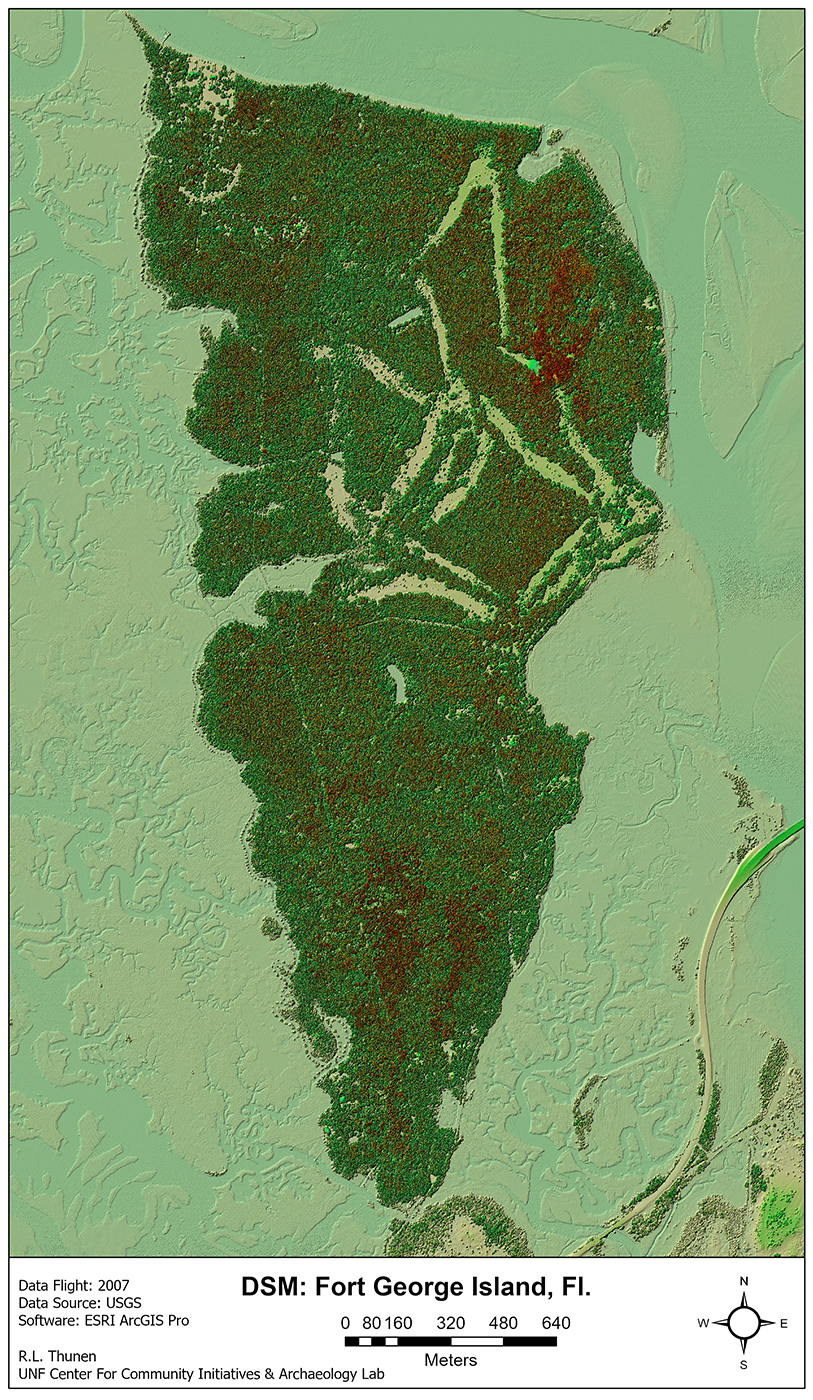
For example, to make Figure 1, the computer had to process all the data from the eight tiles, some 41,604,703 data points! Yes, that is 41 million data points for the Digital Surface model (DSM). Primarily what you see in Figure 1 is the first returns (often called the highest hits), meaning the laser points that “hit the tops of trees, brush and ground surfaces that are exposed. As you can see, Fort George Island has a thickly meshed oak-pine canopy. The old golf course shows up clearly because it is still a cleared space. The top left is the NPS Kingsley Plantation, with many buildings in clear open areas (see Figure 2). Remember, this is not a photograph but a mathematical model based on geodata points recorded in a 3-d database of height (z) and coordinates (XY). Of course, the “rate of return” (the time it takes the laser point to return to the airplane recorder is a critical element in determining the classification of each data point (ground versus top of the tree vs. building).
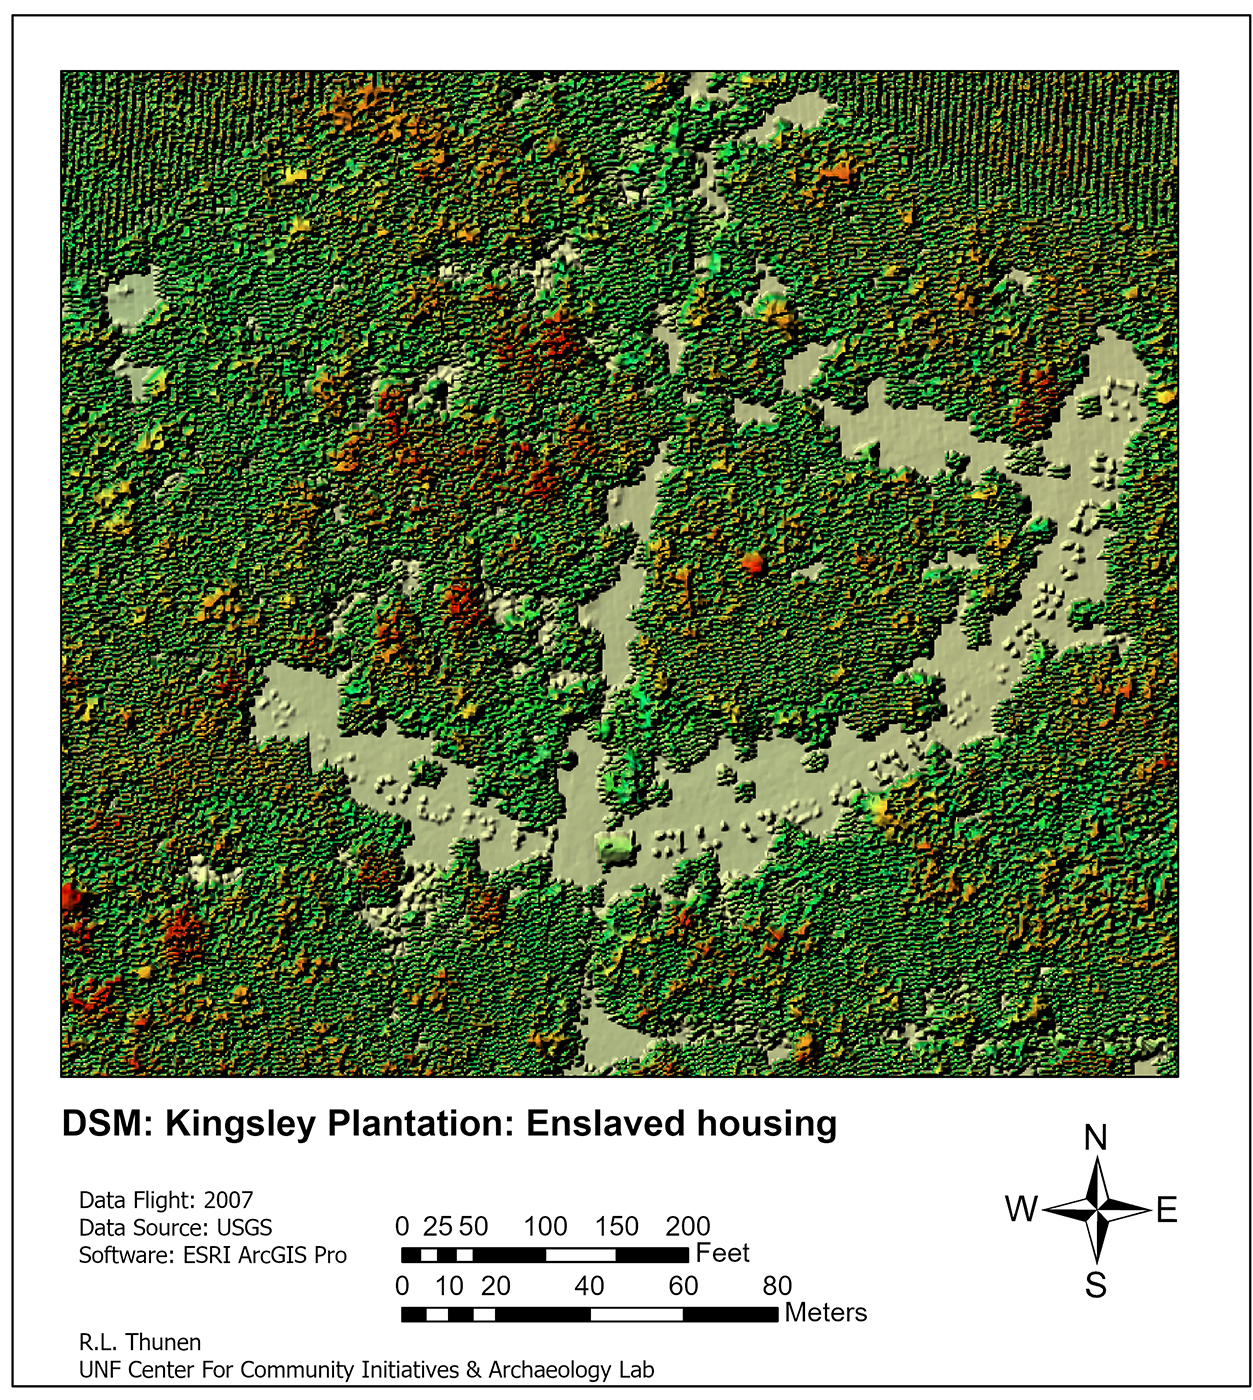
Below (Figure 2) is a closeup of the enslaved housing at the Kinsley Plantation. You are viewing the foundational remains of tabby cabins built in an arc formation. One cabin in the center has a reconstructed roof, so you can see the difference in the Lidar recording. The coloring in the trees is elevation data about the height of the trees. One of the significant commercial uses of airborne Lidar is measuring trees in a forest to determine how much square footage could be harvested from an area to be auctioned by state or federal land managers.
On to DEMs (also called Digital Terrain Models–DTM also referred to as Bare Earth). This is what archaeologists and cultural resource managers are interested in seeing and using. In Figure 3, I asked the computer to remove all the data points not defined as ground. In this case, 9,618,992 data points were defined as ground (23% of the total data points). The Digital Elevation Model is built on those 9 million data points that hit the ground surface during the overflight. So drainage ditches, roads, creeks, and the Pleistocene dune formation (white upper right) show up clearly. Notice that the bridges on A1A (lower right) are gone, but the road is still there: a difference in the machine coding of the data points.
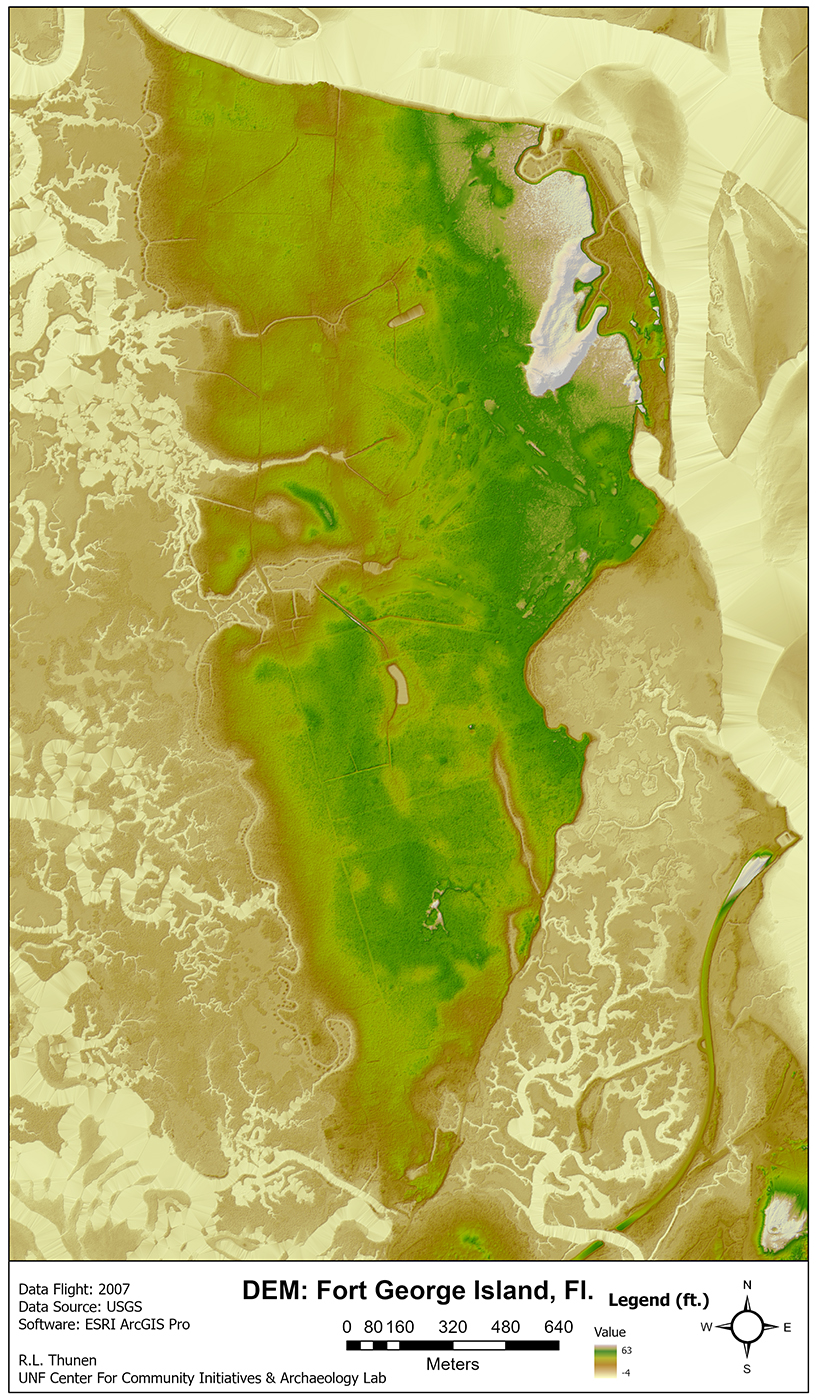
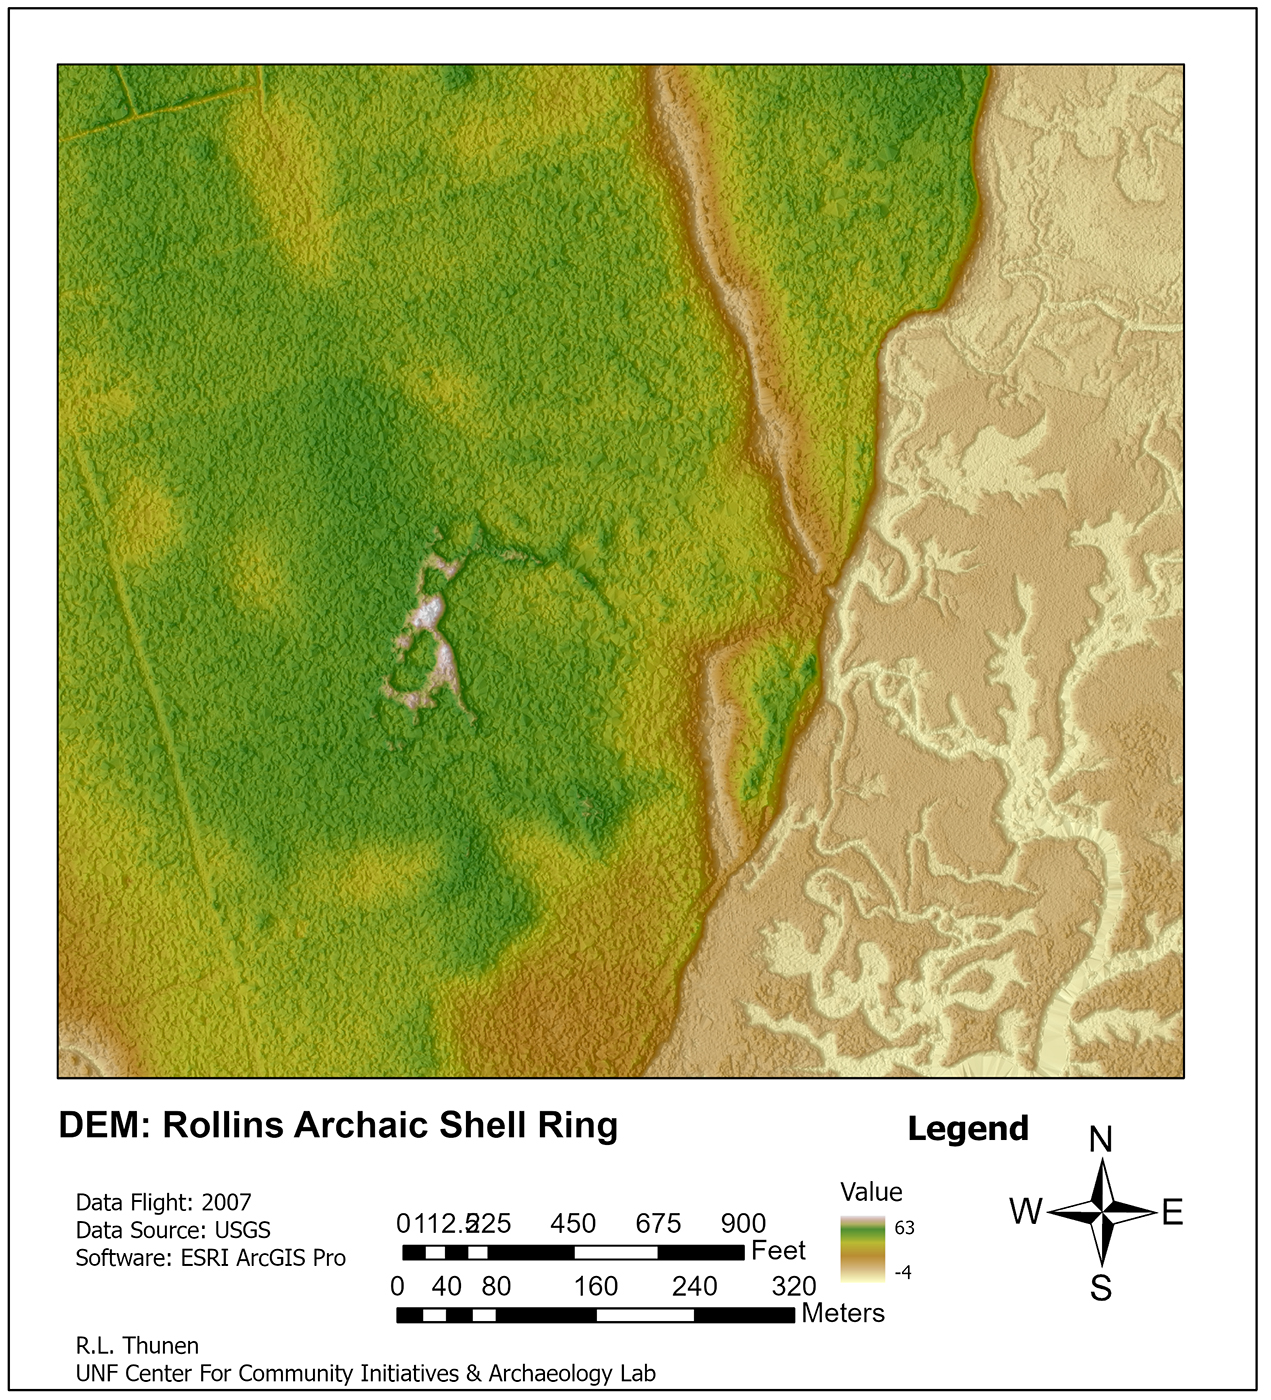
Lastly, a feature that shows up clearly in Figure 3 at the southern end of the island is an extensive prehistoric Archaic Shell Ring. The Rollins Shell Ring is from the Prehistoric Archaic Period. More about this archaeological amazing feature in another blog post.
An essential reference for all things DEM is
Digital Elevation Model Technologies and Applications: The DEM Users Manual, edited by David F. Maune & Amar Nayegandhi. Published by the American Society For Photogrammetry.
I have the 3rd edition in hardcover format, available from the American Society For Photogrammetry.
There is a Kindle version offered on Amazon.
Maps used in this blog were created using ArcGIS® software by Esri. ArcGIS Pro™ is the intellectual property of Esri and is used herein under license. Copyright © Esri. All rights reserved. For more information about Esri® software, please visit www.esri.com.”